
Hammer candlesticks
30.11.2023
Hammer candlesticks , Daily Current Affairs , RACE IAS : Best IAS Coaching in Lucknow
|
For Prelims: About Hammer Candlesticks in Trading,Important points,Importance,As an indicator
|
Why in news:
Recently Nifty surged 95 points to cross the key hurdle at 19,850 level and formed a hammer candlestick pattern on the daily chart.
Important points:
- Hammer candlesticks occur on all timeframes, including one-minute charts, daily charts and weekly charts.
About Hammer Candlesticks in Trading:
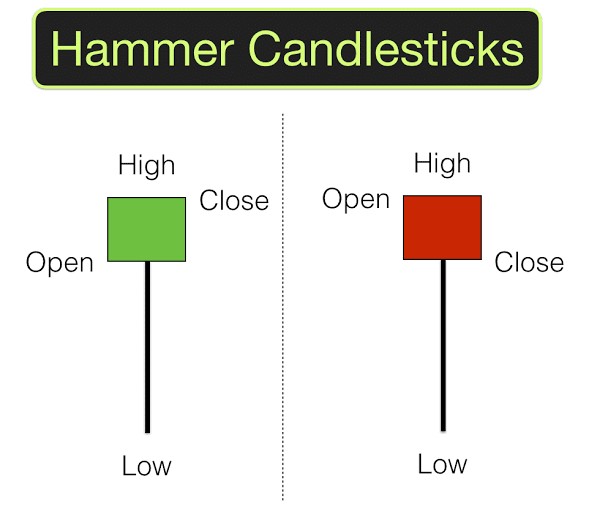
- A hammer candlestick occurs when sellers enter the market during a falling price. By the time the market closes, buyers have exerted selling pressure and pushed the market price closer to the opening price.
- The closing price may be above or below the opening price, although the closing price must be close to the open for the actual body of the candlestick to remain small.
- The body of the candlestick reflects the difference between the opening and closing prices, while the shadows reflect the high and low prices for the period.
- A hammer in candlestick charting is a price pattern that occurs when a security trades significantly lower than its opening price but rises within a period to close close to the opening price.
- This pattern forms a hammer-shaped candlestick, with the lower shadow at least twice the size of the actual body.
Importance:
- This is one of the most popular candlestick patterns that traders use to assess the probability of outcomes when looking at price changes.
- The hammer should look like a "T". This indicates the strength of the hammer candle. The hammer candlestick does not signal a price reversal until it is confirmed.
As an indicator:
- Analysts view it as a potential bullish trend reversal indicator, which mainly appears at the end of a downtrend.
It can be used as a leading intraday indicator to signal changes in bullish/bearish momentum.